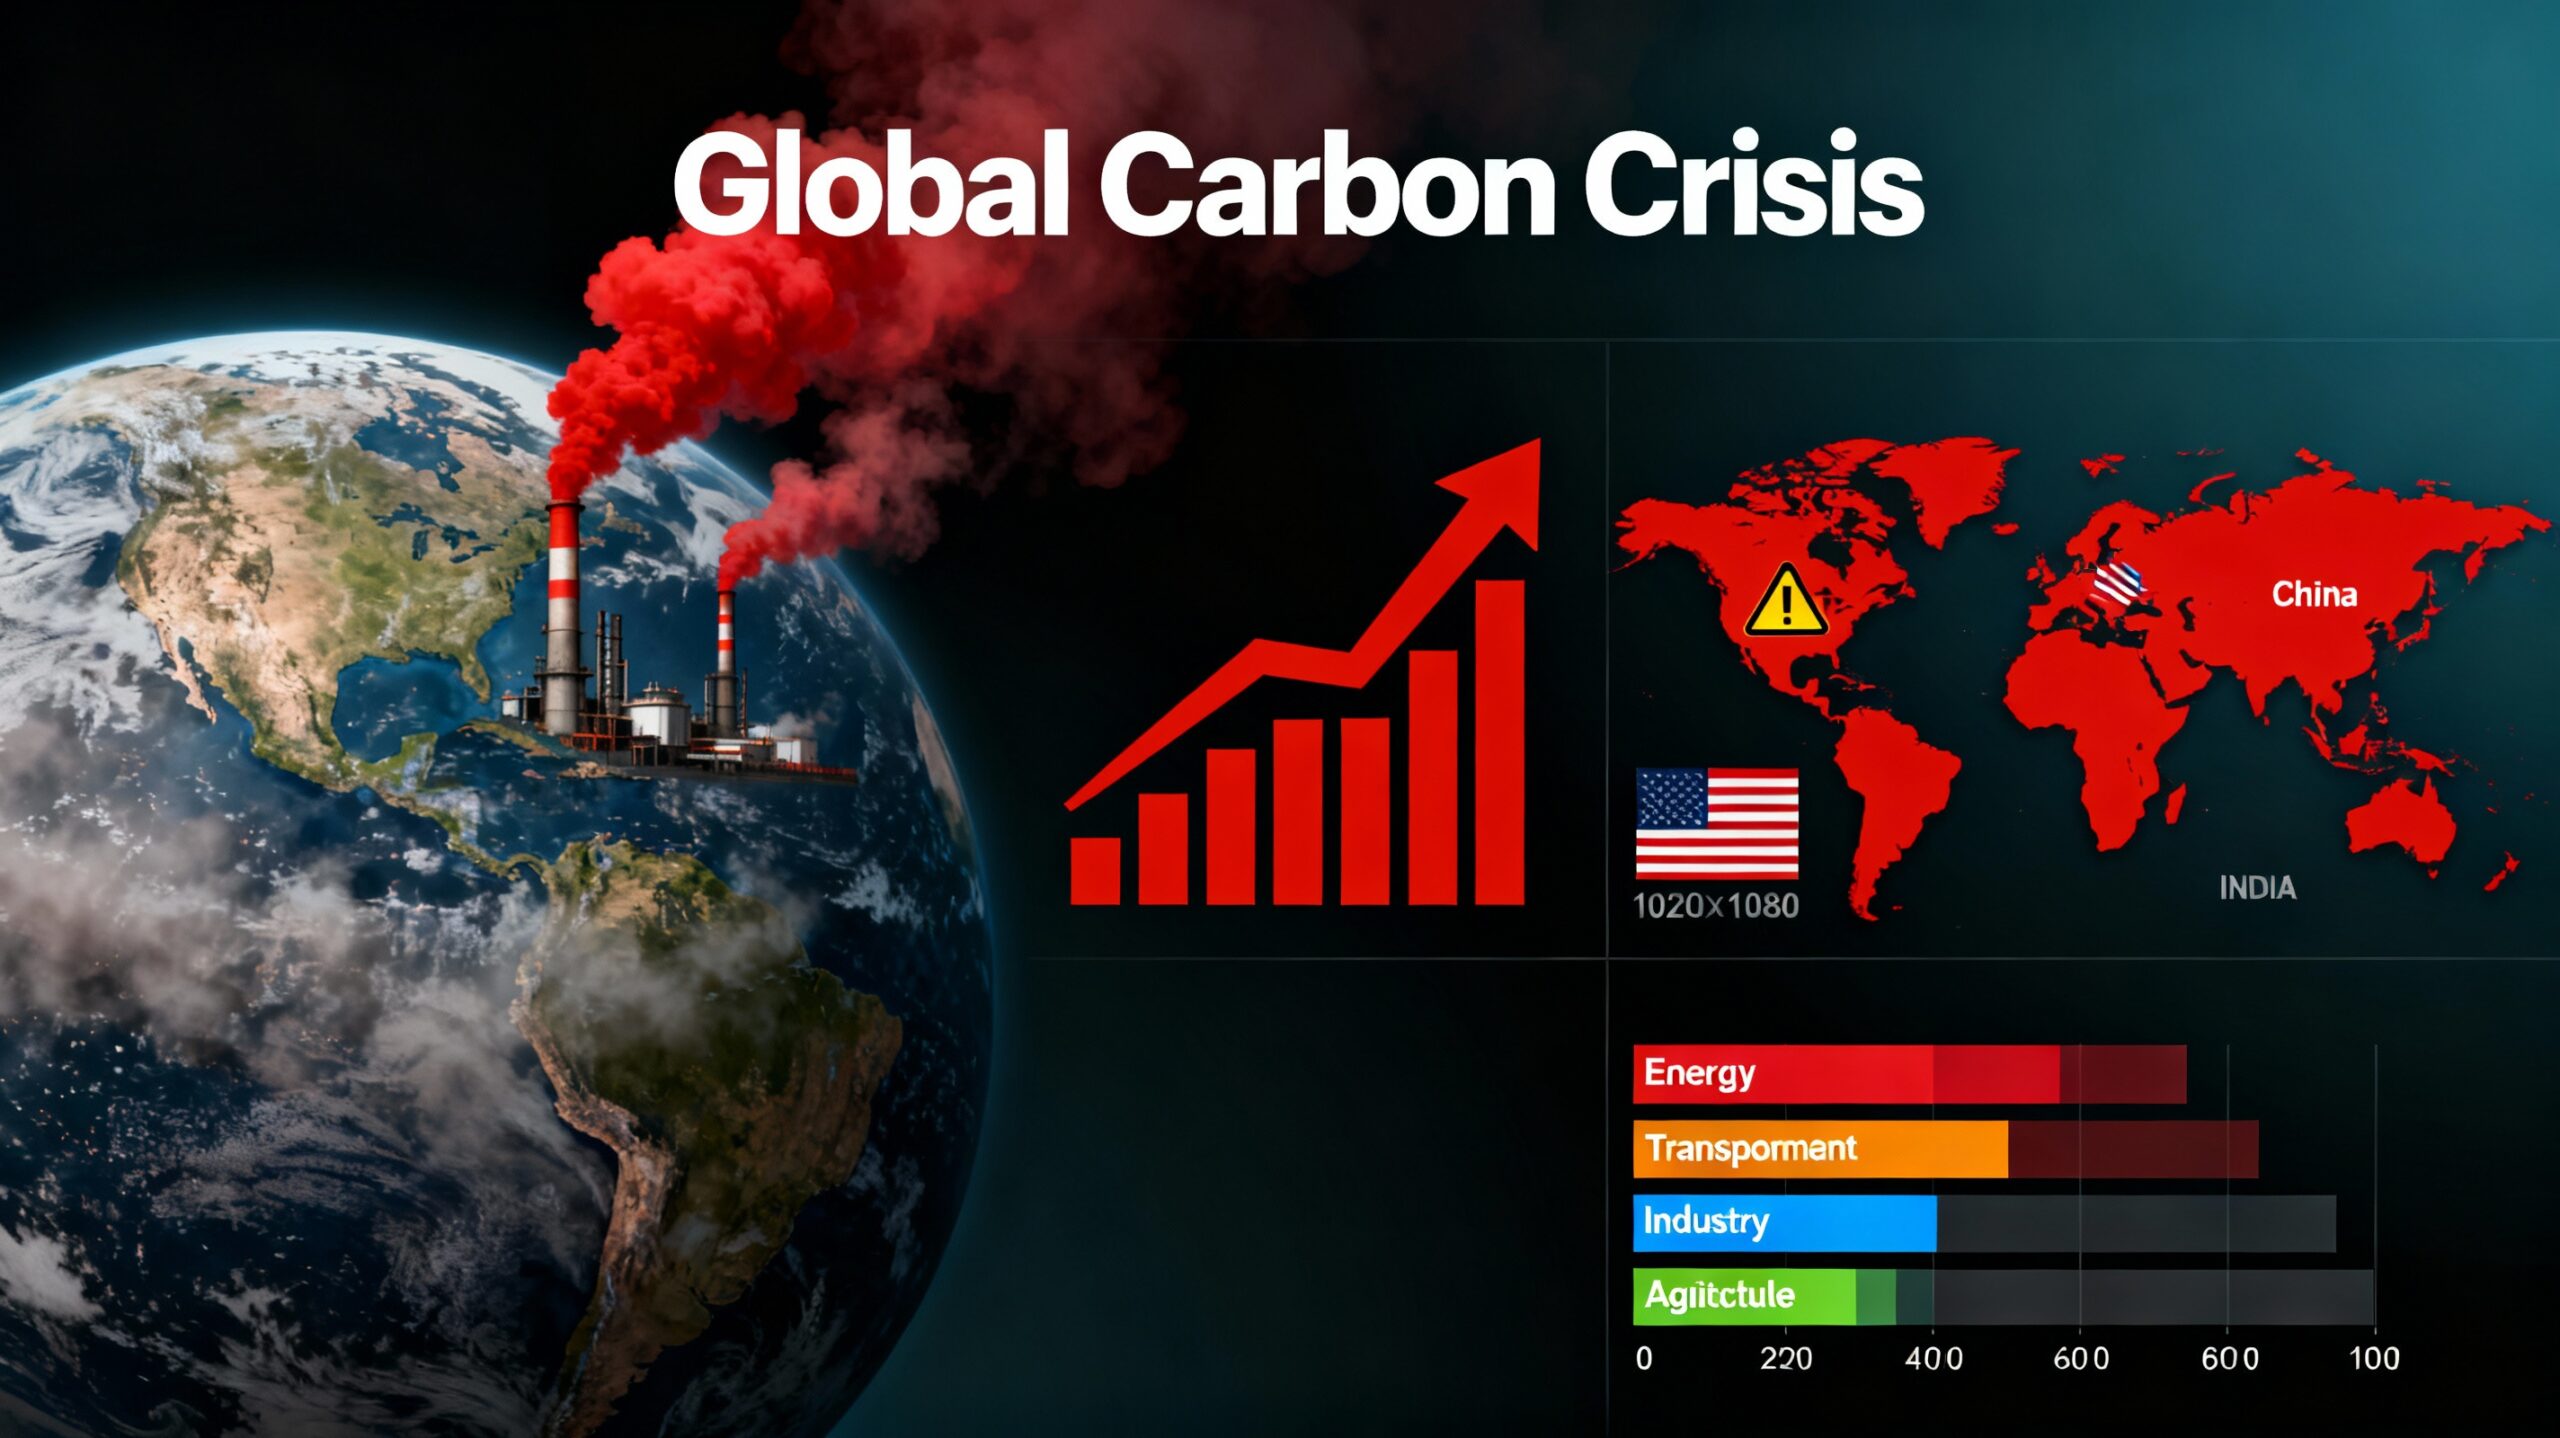
Global Emissions Overview
The world’s carbon emissions are highly concentrated among a small number of countries. The top 10 emitters account for approximately 67% of global greenhouse gas emissions, with three countries alone—China, the United States, and India—contributing nearly 51% of the world’s carbon dioxide.
Top 10 Countries by Total Carbon Emissions (GtCO2e) – 2023-2024
Top 10 Countries by Total Carbon Emissions
China leads by a significant margin with 11.9 gigatons of CO2 equivalent (GtCO2e) annually, representing 30.9% of global emissions. The United States follows as the second-largest emitter with 4.9 GtCO2e (12.6% of global total), while India ranks third with 2.955 GtCO2e (7.3%). Russia, Japan, Germany, Iran, Saudi Arabia, Indonesia, and South Korea complete the top 10, each contributing between 0.67 and 1.76 GtCO2e annually.
It’s important to note that while China and the United States are the largest current emitters, the U.S. has reduced its emissions by 13% since 2010, whereas China’s emissions have increased by more than 38% over the same period.
Emission Sources Breakdown
Carbon Emission Sources Breakdown by Country (%)
The sources of carbon emissions vary across countries but follow a consistent global pattern. Energy and power generation dominates as the primary source of emissions, accounting for 60-82% of each country’s total emissions. This sector encompasses electricity production from coal and fossil fuels, heating, and industrial energy use.
The breakdown of emission sources by percentage is as follows:
Energy/Power Production (60-82%)
This is universally the largest contributor to carbon emissions across all top 10 countries. Coal-fired power plants remain a significant driver, particularly in China where coal electricity generation reached 5.2 GtCO2 in 2023. Global electricity production accounts for approximately 27% of total greenhouse gas emissions when considering all sectors.
Transportation (6-27%)
Transportation is the second-largest emission source in most countries, representing 15% of global emissions overall. The United States leads among the top emitters with 27% of its emissions from transportation, while Russia has the lowest at 6%. Road vehicles account for the vast majority of transport emissions (over 70%), with passenger vehicles contributing about 45% and heavy-duty trucks contributing 29.4% of transport-related emissions.
Industrial Manufacturing (8-30%)
Industrial emissions include cement, steel, chemicals, and other manufacturing processes. Japan has the highest percentage at 30%, while China and the United States each contribute 8% from industrial sources. The manufacturing sector globally accounts for approximately 25% of emissions from direct industrial processes and an additional 6.2 GtCO2 from electricity use in manufacturing.
Agriculture (1-12%)
Agriculture represents the smallest yet still significant emission source, ranging from just 1% in Japan to 12% in Indonesia. Globally, agrifood systems account for about one-third of total anthropogenic greenhouse gas emissions, with livestock production being the dominant contributor.
Global Carbon Emissions Distribution – Top 10 Countries vs Rest of World
Historical Emissions Trends (2015-2023)
Historical Emissions Trends: Top 6 Emitting Countries (2015-2023)
- Shows which countries are reducing emissions (USA -8.4%, Germany -15.9%)
- Identifies fastest-growing emitters (India +34.3%, China +13.3%)
Per Capita Emissions Analysis

Per Capita CO2 Emissions by Country (Tonnes) – 2024
- Reveals individual carbon footprints (Qatar 37.6 tonnes vs India 1.89 tonnes)
- Highlights climate justice and equity dimensions
Renewable Energy Adoption Rates

Renewable Energy Share of Electricity Generation by Country (%) – 2024
- Norway leads at 98%, China at 35%, USA at 26%
- Shows 2024 renewable capacity growth reached record 510 GW
- Details country-specific renewable strategies
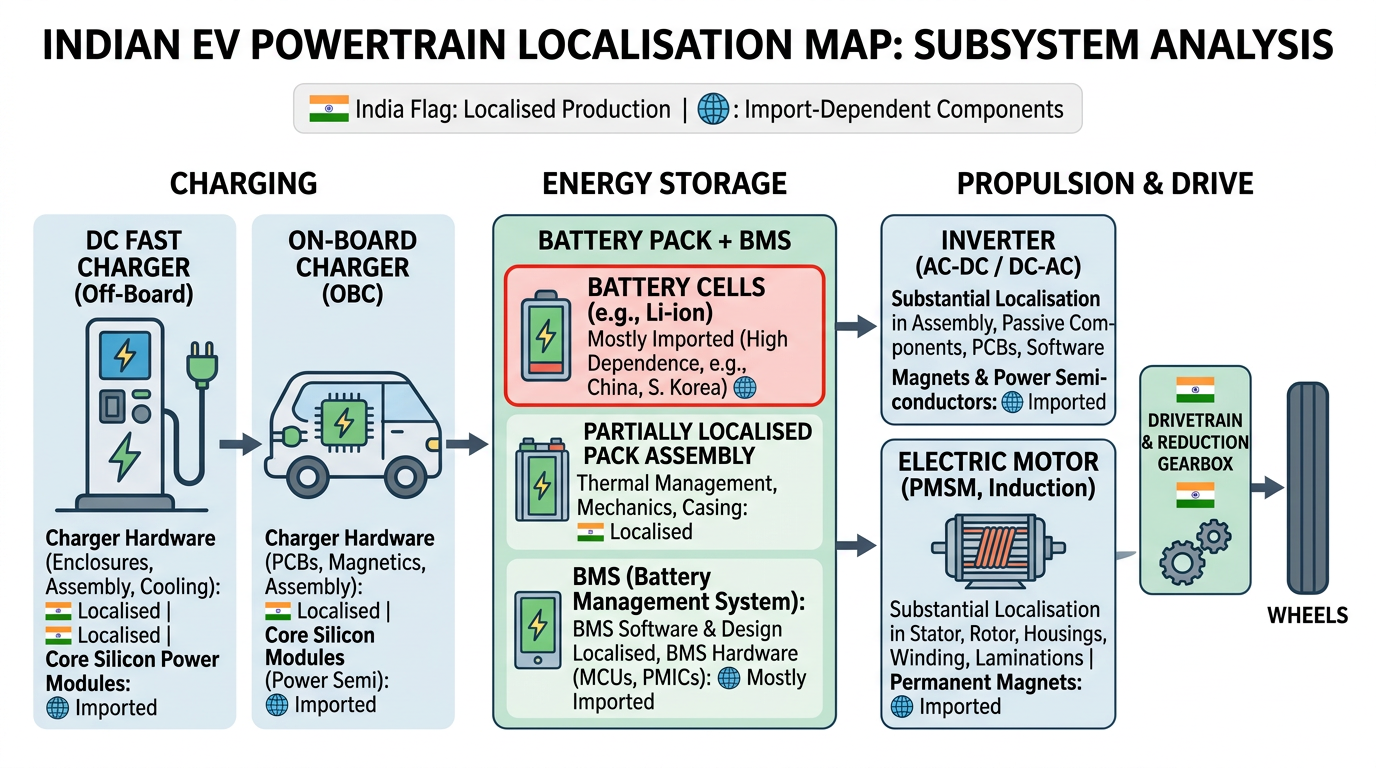
Electric Vehicle Market Analysis

Electric Vehicle Market Share by Country (%) – 2024
- Norway: 88.9% EV market share (world leader)
- China: 11.3M EVs sold in 2024 (67% of global)
- USA: 4.5% market share (growing)
- Lifecycle emissions: EVs produce 73-78% lower emissions than gas cars
- Net-Zero Commitments by Country
- Only 2 countries achieved carbon negativity (Bhutan, Suriname)
- 145+ countries have announced net-zero targets
- Analysis of legally binding vs policy pledges
- Strategic Solutions & Climate Pathways
- Energy transformation strategies
- Transportation decarbonization plans
- Industrial emissions solutions (cement, steel)
- China’s specific transition plan
- China Deep Dive
- Reduced coal permits by 83% in H1 2024
- 2060 net-zero target with detailed pathway
- Global impact of Chinese clean-energy exports (220M tonnes CO2 avoided)
- Comparative Analysis Table
- All-in-one comparison of top 10 emitters
- Shows emissions, trends, renewable %, EV adoption, net-zero targets
- Comprehensive FAQ Section
- Addresses common questions about emissions
- Provides context for reader understanding
- Strategic Recommendations
- For policymakers
- For businesses
- For individuals
Emission sources breakdown

Carbon Emission Sources Breakdown by Country (%)
Historical emissions trends
Historical Emissions Trends: Top 6 Emitting Countries (2015-2023)
Per capita CO2 emissions
Per Capita CO2 Emissions by Country (Tonnes) – 2024
Renewable energy adoption
Renewable Energy Share of Electricity Generation by Country (%) – 2024
EV market share
Electric Vehicle Market Share by Country (%) – 2024
Key Insights
The concentration of emissions among a few nations reveals that targeted climate action in these top 10 countries could yield substantial global impact. China’s massive energy sector emissions highlight the importance of its renewable energy investments, while the United States’ higher transportation emissions underscore the potential for electric vehicle adoption to reduce overall emissions. India’s rapid emissions growth, coupled with its developing infrastructure, presents both challenges and opportunities for implementing cleaner technologies early in its industrial expansion.
The dominance of energy and power generation across all countries underscores the critical importance of transitioning to renewable energy sources as a primary strategy for global carbon reduction.